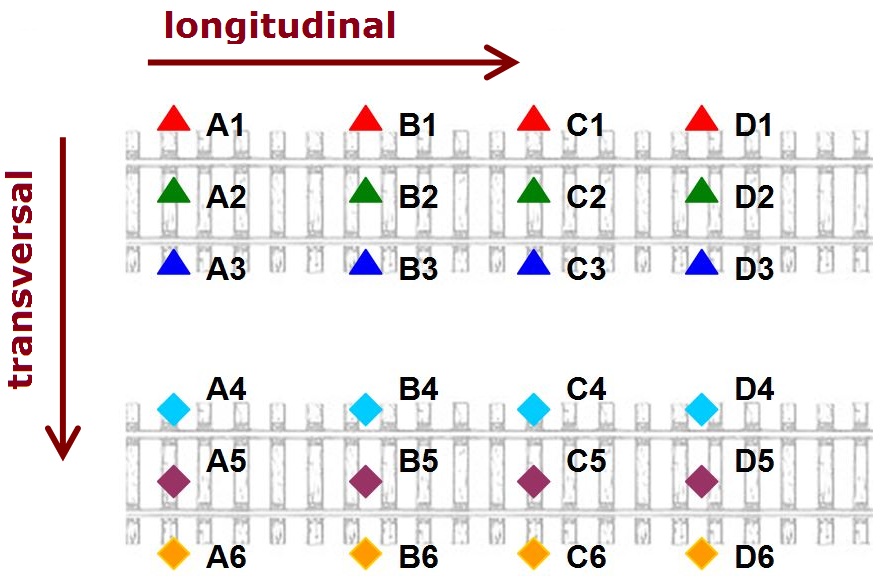
Profile graphs are a graphical representation of the monitoring data along the transversal and longitudinal profiles. The profile graph displays numerical values based on user specified profiles (e.g. train tracks, highway, etc.).
Using the information displayed in the figure above, an example for the transversal profile is A1 – A2 – A3 – A4 – A5 – A6, and for the longitudinal profile is A1 – B1 – C1 – D1. Transversal profiles are noted on the x-axis (shown in the graph below as T1, T2...), and longitudinal profiles are noted in the graph legend (L1, L2…).
To create the profile graph for the monitoring data follow the steps:
Open Graph designer and drag and drop Standard Profile graph template to the Graph area.
Click on Edit graph template icon and define Longitudinal and transversal profiles in the template.
Define longitudinal and transversal profiles in the Customize tab of the Edit graph template.
Points that should be connected are divided by commas, profiles are divided by semicolons. A missing point is acknowledged by typing nothing between two commas, between equation sign and comma or comma and semicolon. The entry in not case sensitive.
If the monitoring points are named like in the image:
then the points of an individual profile that should be connected with Longitudinal Profiles lines will be defined as follows:
L1=A1,B1,C1,D1; L 2=A2,,C2,D2; L3=,,C3,D3; L4=A4,B4,C4,; L5=A5,,,D5; L6=,B6,C6,D6;
Transversal Profiles will be defined as follows:
T1=A1,A2,,A4,A5,;T2=B1,,,B4,,B6;T3=C1,C2,C3,C4,,C6; T4=D1,D2,D3,,D5,D6;
The profile graph with the given profiles will be:
where names of longitudinal profiles (here L1, L2, ...) are in the graph legend, names of transversal profiles (here T1, T2, ...) are tick-marks on the X axis.