This topic gives you a tutorial how to add and use shape files inside GeoMoS Now!. Shape files are a common standard for representing geospatial vector data.
You can insert additional information about your monitoring site by downloading freely distributed shape files from the internet, or by making your own files i.e. from CAD file drawings. In this example we will use both of them:
Worflow 1: We will use a shape file for a monitoring site in local coordinate system.
Worflow 2: We will use a shape file from the same local coordinate system but show it over an internet-based map.
In this example:
Data are coming from a GeoMoS Monitor project in Swiss LV03 coordinates that is based on Bessel ellipsoid.
Our vector data is a shape file in the same coordinate system.
We want data to be displayed in all GeoMoS Now! maps in the same coordinate system.
Procedure is the same with any other custom coordinate system.
|
Step |
Action |
|
1 |
Go to GeoMoS Now!. From the left menu open Settings → Maps. |
|
2 |
Select the +Add new shape file layer, set the name and point to the Houses.zip archive that contains the Houses.dbf; Houses.shp and Houses.shx files. |
|
3 |
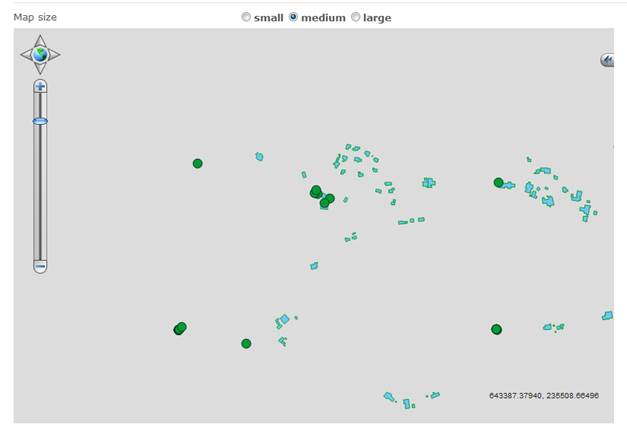
Change the color of areas to blue, set transparency to 0% and press OK to upload the file. |
In the Map view on the bottom of the screen we already see the uploaded data. The sensors from monitoring project are always marked with green points in this view.
Map tab of the overview or sites pages will display data in the same coordinate system as the GeoMoS Monitor does.
In this way you can add many layers to add information about your monitoring site. You can also use different coloring possibilities with area/point class break option. Settings from this page are applied in all Map tabs in the GeoMoS Now!.
Use Configuration menu on the left to create or edit the maps displayed for your overview and sites.
In this example we continue with the Workflow 1.
Data are still coming from a GeoMoS Monitor project in Swiss LV03 coordinates that is based on Bessel ellipsoid.
Our vector data is a shape file in the same coordinate system.
We want data to be displayed in all GeoMoS Now! maps on a Google map.
|
Step |
Action |
|
|
Continue with the project from Workflow 1. |
|
1 |
To upload the TRFSET.DAT file turn on both checkboxes:
|
|
2 |
The positions from sensors in GeoMoS Monitor are now correctly transformed from state coordinate system on Bessel ellipsoid to WGS84 based projection coordinates.
The shape file that was uploaded in the Workflow 1 still has the GeoMoS coordinates so we cannot see it any more. |
|
3 |
We will upload another shape file layer as Houses_local_to_WGS. This ZIP archive consists of the files from the Houses.zip archive mentioned in the Workflow 1 and an additional Houses.prj file. This PRJ file defines the difference between two ellipsoids for a certain area with a sentence like (…,TOWGS84[674.4,15.1,405.3,0,0,0,0]…). |
|
4 |
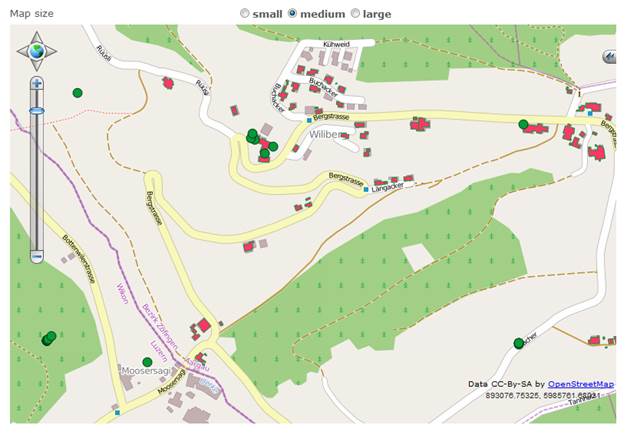
Set the transparency to 0% and color for areas to red. |
In the Map view on the bottom of the screen now we see a Google map. Zooming into our monitoring site location, we can see over the map also the uploaded vector data of the measured houses.
Settings from this page are applied in all Map tabs in the GeoMoS Now!. Use Configuration menu on the left to create or edit the maps displayed for your overview and sites.