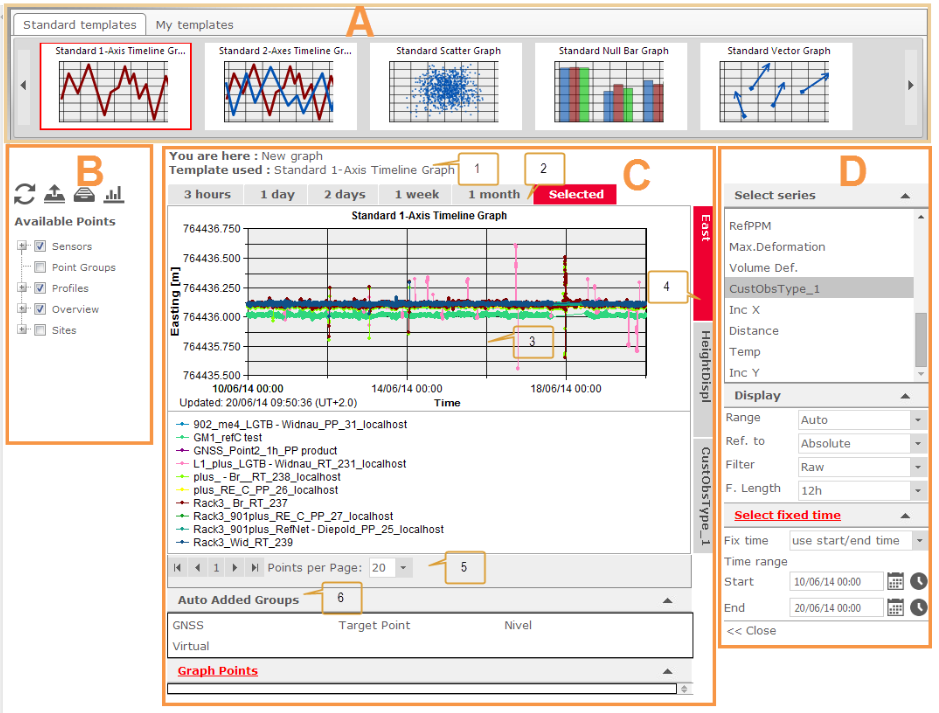
Graph designer is a central page to create, edit and save graphs. A graph is defined by its template, its data (points and series) and additional settings regarding the calculation and visualization. Graphs can be saved by adding them to an overview or any of the sites, adding them to the dashboard or saving them to the folder My Graphs.
Use the Graph designer to:
create a new or edit the existing graph and assign it to a site, overview, dashboard or report,
create the new or edit the existing graph template.

Graph designer interface consists of the following parts:
Top menu (A),
Left menu (B),
Main menu (C), and
Right menu (D).
The top menu contains the available graph templates. There are Standard templates and graph templates created by user. The user defined templates are created by changing the templates of available graph types. To store changes, click on the save ![]() icon in the left menu. User defined templates can be deleted by clicking on the x-sign on each of templates.
icon in the left menu. User defined templates can be deleted by clicking on the x-sign on each of templates.
The left menu consists of menu icons and list of available points.
Following menu icons are available:
Reload ![]() icon to apply any changes in the settings and to update the graph accordingly.
icon to apply any changes in the settings and to update the graph accordingly.
Save/Add to ![]() icon to save and assign graphs to dashboard, overview, site or report, to save the graph in My graphs space, or to save the modified graph template.
icon to save and assign graphs to dashboard, overview, site or report, to save the graph in My graphs space, or to save the modified graph template.
My graphs ![]() icon to open and view the save graphs. My graphs works as a graph pool or a folder to save your finished graphs for later use, or to save those graphs which are not attached to an overview or a site.
icon to open and view the save graphs. My graphs works as a graph pool or a folder to save your finished graphs for later use, or to save those graphs which are not attached to an overview or a site.
Edit graph template ![]() icon to customize the graph by editing the graph template.
icon to customize the graph by editing the graph template.
|
|
The changes to the graph template will be applied to all graphs using that template. |
The point list shows all available points and point groups defined in GeoMoS Monitor. The points are listed in several groups sorted:
by sensor type defined in GeoMoS Monitor,
by point groups defined in GeoMoS Monitor,
by profiles defined in GeoMoS Monitor,
as added to the overview,
as added to sites.
Points appear in the overview and sites groups either when a graph containing these points is added to an overview or to a site or in the case when a point is added to an overview or to a site using the Point Management.
Based on a selected settings this area will be filled with a graph and its information. Main menu consists of:
|
Field |
Description |
|
Status bar (1) |
Status bar gives a quick overview about the graph that is currently edited and to which site it belongs. It informs as well about which graph template is used. |
|
Time range tabs (2) |
The Time range tab shows the available time periods for data visualization. Time range tabs allow a fast change between the most common time ranges.
Define general time tabs in Settings → Time. To use an individual time range that is not pre-defined select the Selected tab. This time range can be defined in the Right menu → Select fixed time area. |
|
Graph area (3) |
This area displays the graph according to the selected properties, as well as the graph legend.
|
|
Series tabs (4) |
In the Series tab it is possible to assign up to three series to one graph. It allows for a fast switch between the most common time series. |
|
Navigation (5) |
Depending on the amount of data a graph can consist of many pages. Use the navigation bar to navigate between the pages and to modify the number of visible points per page. The points that have no data for the current time selection will not be listed in the legend. |
|
Point list (6) |
All graph points and auto-added point groups are listed in this area. |
The right menu offers three different setting groups:
Select series,
Display settings,
Select fixed time range for the custom Selected time tab.
These series depend on the selected graph template. More detail on each of this settings is given in section Graph templates.